 |
Last Update:
Thursday November 22, 2018
|
| [Home] |
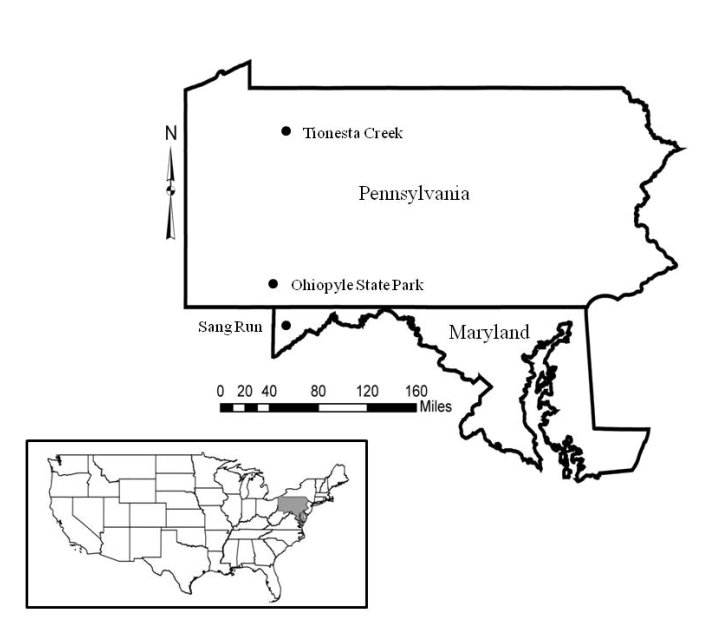
INTRODUCTION Nearctic river otters (Lontra canadensis) were extirpated from much of their native range through unregulated harvest and habitat degradation by the early 1900s (Melquist and Dronkert, 1987; Lariviere and Walton, 1998). Efforts to restore river otter populations have included reintroduction or supplementation efforts in 21 states and Alberta, Canada (Melquist et al., 2003). The resulting populations are now established or expanding into much of the area from which river otters were extirpated (Melquist et al., 2003), creating the need for effective methods of monitoring these populations. The secretive nature of river otters combined with ethical (Bekoff and Jamieson, 1996) and logistical considerations (i.e. relatively high cost) often limits monitoring efforts to indirect detection methods (Swimley et al., 1998). Sign surveys (i.e. visually scanning riparian areas for otter sign) have been a common method of detecting otters in North America (river otter;Mowbray et al., 1976; Melquist and Hornocker, 1979; Dubuc et al., 1990; Swimley et al., 1998; Mills, 2004) and Europe (Eurasian otter Lutra lutra; Jenkins and Burrows, 1980; Conroy and French, 1987; Macdonald and Mason, 1987; Kruuk et al., 1989; Delibes et al., 1991; Ruiz-Olmo and Gosálbez, 1997). River otters scent mark by depositing scat, urine, and glandular secretions at conspicuous riparian locations called latrine sites (Melquist and Hornocker, 1983; Newman and Griffin, 1994; Swimley, 1996; Swimley et al., 1998), which are thought to focus opportunities for intraspecific communication through olfaction (Melquist and Hornocker, 1983). Latrine sites, areas where river otters scent mark, are the most common and easily identified field sign of river otters and are characterized by the presence of scats, anal sac secretions, and a diagnostic, fishy odor (Mowbray et al., 1976; Swimley et al.,1998). Seasonal variation in scent marking intensity has been reported previously for river otters, with peaks in spring (March-April) and fall (September-November) in Pennsylvania (Serfass, 1994; Mills, 2004; Stevens, 2005). Although the function of scent marking may not be the same in other species, seasonality also has been documented in the scent marking of Eurasian otters generally with a peak in winter and a low in summer (Gorman et al., 1978; Mason and Macdonald, 1986; Macdonald and Mason, 1987; Kruuk, 1992; Jahrl, 1995; Ruiz-Olmo and Gosálbez, 1997). Identifying seasons during which otters are more likely to scent mark may help improve the efficiency of monitoring efforts. Peaks in scent marking intensity have been attributed to communication of breeding condition (Eurasian otter - Gorman et al., 1978; river otter - Mills, 2004; Stevens, 2005), emergence of cubs (Eurasian otter - Macdonald and Mason, 1987; Conroy and French, 1987; Jahrl, 1995; river otter - Olson et al., 2005), signaling the use of resources (Kruuk, 1992), intra-group male communication (Eurasian otter - Durbin, 1989; river otter - Rostain et al., 2004; Ben-David et al., 2005), and male-female communication relating to reproductive condition (Eurasian otter - Gorman et al., 1978; river otter - Mills, 2004). However, the parameters underlying seasonal variation in river otter scent marking behavior are still poorly understood complicating efforts to develop efficient population monitoring techniques that use latrine sites. Our objective was to quantify parameters associated with river otter visits to latrine sites. We were particularly interested in using remote cameras to assess variation in group sizes, times of visitation within and among seasons and temporal variation of visitation concurrently with an assessment of scent marking variation at individual latrine sites. By combining the analysis of visitation and scent marking at individual latrine sites, we provide a more comprehensive assessment of river otter scent marking behavior than has been attempted previously for wild populations. STUDY AREA Our study areas were located in 2 drainages, Tionesta Creek and the Youghiogheny River, both of which support populations of river otters established through reintroductions (Mills, 2004). Tionesta Creek is located in northwestern Pennsylvania and flows generally west through the Allegheny National Forest. Tionesta Creek enters the Allegheny River at the borough of Tionesta, Forest County, approximately 85 km from its headwaters in Elk (South Branch) and McKean Counties (East Branch; Swimley, 1996). We monitored 3 latrine sites within a 13-km section along the southern bank of Tionesta Creek (41º35’N, 78º15’W), between the bridge at Kelletville and 2 km upstream of the bridge at Mayburg.
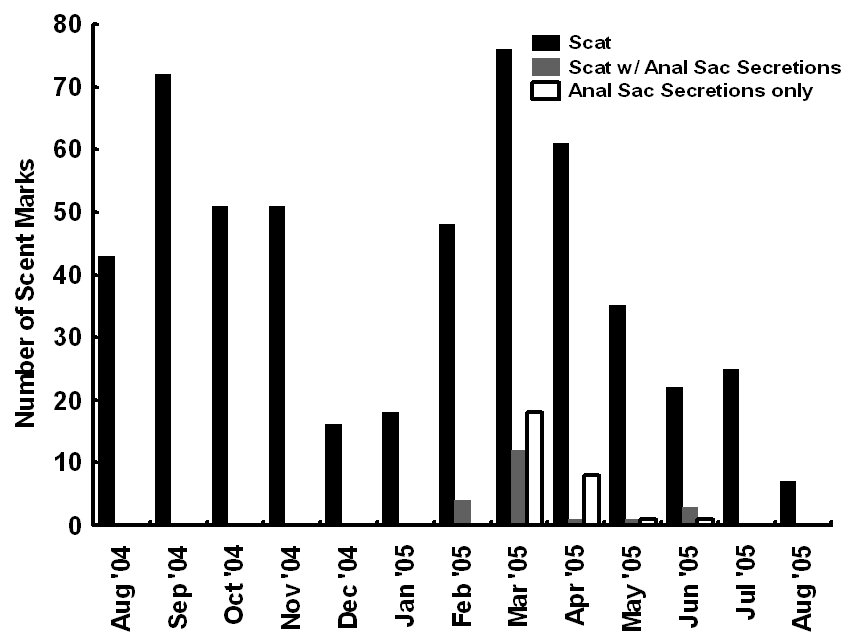
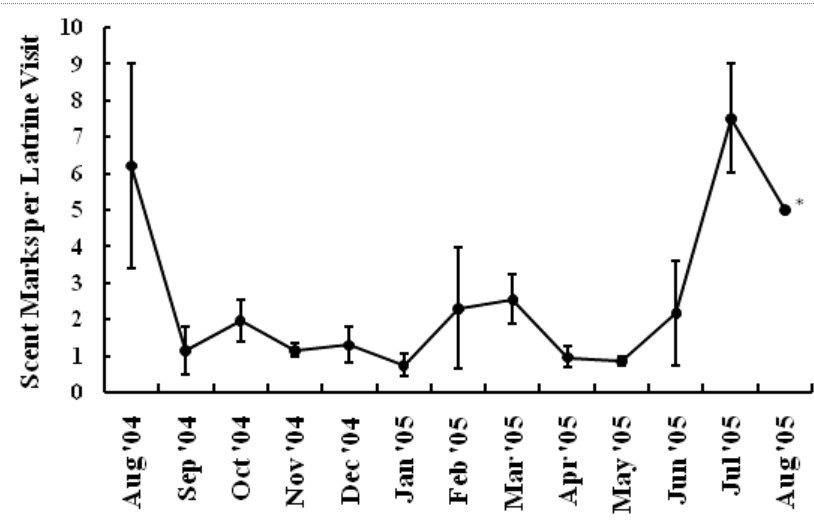
The Youghiogheny River originates in West Virginia, flows north through Garrett County, Maryland, and converges with the Monongahela River south of Pittsburgh, Pennsylvania. In Maryland, we monitored 1 latrine site along the western bank of the Youghiogheny River, situated about 1 km upstream from the bridge at the town of Sang Run (39º34’N, 79º25’W). In Pennsylvania, we monitored 4 latrine sites in a 13-km section along the southwestern bank of the Youghiogheny River in Ohiopyle State Park (39º50’N, 79º26’W), Fayette County, between the town of Ohiopyle and the mouth of Ramcat Run. The study areas are proximate to roads and accessible to humans, and, as such, could be considered typical of rural Pennsylvania and Maryland (Figure 1). METHODS From 1 August 2004 through 31 August 2005, we used TrailMaster® video (TM-700V) and still (TM-500 and 550) cameras (Goodson and Associates, Lenexa, Kansas, U.S.A.) and Reconyx Silent Image™ digital cameras (Reconyx, La Crosse, Wisconsin, U.S.A.) to detect river otters visiting latrines. The cameras took a picture or recorded video when infrared sensors were “triggered” by an animal’s heat and motion. An animal would continue to trigger a camera as long as it moved in front of the sensor. Therefore, we programmed the delay and sensitivity settings of each camera system to conserve film, tape, or memory, but also to remain sensitive enough to enhance the likelihood that each river otter visit was recorded. When triggered, TrailMaster® still cameras were programmed to take a picture at a maximum rate of once per minute; Reconyx Silent Image™ cameras were programmed to record an image at a maximum rate of once every 10 sec; and TrailMaster® video cameras were set to record for 3 min, and to continue recording as long as the animal continued to re-trigger the sensor. We adopted sensitivity and delay settings for the TrailMaster® systems from Stevens (2005). We assumed that the detection of river otters was equally efficient among camera systems. Active latrine sites were selected for monitoring during sign surveys for river otters conducted in the study areas immediately before our investigation (see Mills, 2004; Stevens, 2005). Remote cameras were checked at least bi-weekly to monitor performance, download events (TrailMaster®) or images (Reconyx™) and, if necessary, replace film or digital videotape (TrailMaster®). The latrine site, date, time, and group size of each river-otter-detection was recorded during our review of the images and videos. River otter scent marks—categorized as scats, anal sac secretions, and scats with associated anal sac secretions (secretions exuded with scat) were counted at the latrine site each time cameras were checked and were crushed by foot to eliminate recounting. Although all scent marks potentially facilitate communication among river otters, we restricted our definition to those scent marks readily detectable by the researcher in all seasons: scats and anal sac secretions. Camera systems were in constant deployment throughout the study period. However, mechanical or human errors (see Stevens, 2005) often resulted in camera malfunctions. Therefore, we quantified functional latrine-nights (i.e. at least 1 camera was operating properly) at each latrine site by month to facilitate comparisons among latrine sites. The term “latrine-night” was used instead of camera-night because some latrines were monitored with 2 cameras. We used 2 temporal categories for comparisons: months and seasons. Seasons were defined as: spring (March, April, and May), summer (June, July, and August), fall (September, October, and November), and winter (December, January, and February). To define a “visit” by an otter or group of otters to a latrine site, we assigned 30 min as the time period after which camera detection was independent based on our observations of the average time river otters spent at latrines and to follow previous work by Stevens (2005). Thus, all detections separated by ≤30 min at a latrine site were classified as 1 visit. The largest number of individuals observed during a visit was assigned as that visit’s group size. Scent marking Visitation and group size We categorized time of visit as nocturnal, diurnal, or crepuscular. The crepuscular period was defined in all seasons as 30 min before to 30 min after both sunrise and sunset. The average daylight internal for each season was used to define the boundaries of each time category within seasons and was calculated as the average lengths of the daylight periods from the 15th day of each month in that season (http://aom.giss.nasa.gov/). We calculated the length of the nocturnal period by subtracting the average daylight hours and the 2 crepuscular hours from 24. We tabulated visits occurring in nocturnal, diurnal, and crepuscular periods by group size (1, 2, and ≥3) and season (spring, summer, fall, and winter) across the study period. We then evaluated proportional differences in the frequencies of visitation among time categories, group sizes, seasons, and the interactions of these variables using log-linear analyses (STATISTICA, 2004). Separately, we constructed a forage model (Williams and Marshall, 1938), based on selection indices (Krebs, 1998), using the proportion of 24 hr each time category comprised to determine if river otters selected nocturnal, diurnal, or crepuscular periods to visit latrine sites in each season. Data from time categories were pooled across study areas for this analysis. Periodicity RESULTS Latrine sites were monitored for 3,127 latrine-nights. The cameras yielded 2,698 functional latrine-nights, with 429 latrine-nights lost due to camera malfunction or human error. One or more river otters were detected 500 times in 327 observed visits to latrine sites. The number of river otter detections per functional latrine-night across the study period was 0.185. Scent marking Visitation and group size River otters visited latrine sites at night (n=231, 70.64%) 4 times more often than during the day (n=54, 16.51%) and 5 times more often than during crepuscular periods (n=42, 12.85%). The highest seasonal frequency of diurnal visits occurred in winter (n=21, 20.79%). Over 45% of all recorded latrine visits were single otters at night (n=148). The most parsimonious log-linear model included the term “time of visit” and the interaction term “season × group size” (maximum likelihood χ 2 = 19.830, df = 19, P=0.405). This model indicates that time of visit did not differ among seasons or group sizes and that group size varied proportionally among seasons. Based on our forage model analysis, river otters selectively visited during nocturnal periods in spring and selectively visited during nocturnal and crepuscular periods in summer, fall, and winter (Table 1). Diurnal periods were never selected (Table 1). Periodicity DISCUSSION We are aware of no other study concomitantly examining aspects of latrine site visitation and scent marking by river otters. Rostain et al. (2004) and Mills (2004) examined scent marking whereas Stevens and Serfass (2008) and Ben-David et al. (2005) analyzed visitation to latrines. Although the number of latrine sites we monitored was small, our study supports previous work suggesting that river otter scent marking varies seasonally in Pennsylvania and Maryland. We observed seasonal peaks in total scent marking in fall (September) and spring (March) similar to those previously reported in Pennsylvania and Maryland (Serfass, 1994; Mills, 2004; Stevens, 2005; Stevens and Serfass, 2008). The fall and spring peaks in scent marking correspond with 2 distinct periods in the natural history of river otters: mobility of young-of-the-year juveniles and the breeding season, respectively. The fall peak in scent marking has been hypothesized to result from the highest seasonal density of marking individuals as juvenile river otters begin traveling to latrine sites with their mothers (Mills, 2004). Olson et al. (2005) supported this “traveling family” hypothesis with photographs of juveniles and an adult visiting latrine sites in the late summer and fall. A positive feedback loop (i.e. scent marking by an individual triggering scent marking by other individuals) was cited as a possible mechanism by which larger group sizes consequently resulted in more scent marks at a latrine site (Melquist and Hornocker, 1983; Olson et al., 2005). The presence of cubs also has been cited as a possible mechanism for increased scent marking observed in Europe (Macdonald and Mason, 1987; Conroy and French, 1987; Jahrl, 1995). Our results are consistent with the “traveling family” hypothesis for the fall peak in scent marking. Average group size visiting latrine sites was higher in the fall than at any other time of the year, and, despite relatively low visitation rates, the number of scent marks per month in the fall was nearly that occurring in the spring. Therefore, family groups traveling to latrine sites likely deposited more scent marks per visit resulting in the observed fall peak in scent marking. The spring peak in scent marking, and the only period in which we encountered anal sac secretions (February–mid-June), slightly precedes and overlaps what is thought to be the breeding season for river otters in Pennsylvania and Maryland (Hamilton and Eadie, 1964; Mowbray et al., 1979; Melquist et al., 2003). Mills (2004) hypothesized that the spring peak in scent marking, and particularly anal sac secretions, serve some purpose during the breeding season. However, the actual function of anal sac secretions is unknown. The difficulty in ascribing a function to the secretions is two-fold. First, few authors have documented the occurrence or frequency of anal sac secretions during scent mark surveys. The only detailed information on this topic comes from a comprehensive study of 2 captive Eurasian otters where both sexes marked with anal sac secretions in apparent synchrony with the female’s estrus cycle (Gorman et al., 1978). There have been descriptions of anal sac secretions occurring in the context of anger or fright (see Liers, 1951; Melquist and Hornocker, 1983) and starvation (Carss and Parkinson, 1996) but nothing comparable to the Eurasian otter study has been published for river otters. Second, identifying the gender or age of the individual depositing a secretion was not possible with remote cameras. River otters were not sufficiently sexually dimorphic to differentiate genders from photographs and any disparity in length between adults and juveniles was distinguishable only from late summer through early fall. Even if individual identities could be determined from photographs, images of river otters depositing anal sac secretions were rarely obtained during our study. Reports from radiotelemetry studies describe the generally nocturnal habits of river otters (Larson, 1983; Melquist and Hornocker, 1983; Melquist et al., 2003). Diurnal activity has been reported to increase during winter (Melquist and Hornocker, 1983; Melquist et al., 2003), in areas with little human disturbance (Melquist and Hornocker, 1983), or in restricted areas around resting sites (Larson, 1983; Woolington, 1984; Melquist et al., 2003). Our study confirms that river otters visit latrine sites most often at night; diurnal visits, although uncommon, were proportionally most frequent during winter. However, based on our forage model analysis, river otters also selectively visited during crepuscular periods in fall, winter, and spring. Crepuscular activity recently has been revealed for Eurasian otters by means of novel, in-stream infrared sensors (Garcia de Leaniz et al., 2006). CONCLUSIONS Identifying patterns of temporal and spatial variability in scent marking should allow researchers and managers to more efficiently conduct surveys for river otter scent marks (Kranz, 1996). Much of the research in this area has been conducted on Eurasian otter populations (see Hutchings and White, 2000; Ruiz-Olmo et al., 2001), whereas little work on the variability of scent marking in river otter populations has been reported previously. We documented substantial seasonal differences in the average number of days between visits suggesting that the effectiveness of scent mark surveys also might vary by season. Intuitively, detecting river otter presence using latrine sites would be more efficient as the intensity of visitation increases. Stevens (2005) advocated spring scent mark surveys as the most effective because visitation was highest during that season. We also documented the highest rates of visitation in the spring along with the lowest heterogeneity in scent marking among latrine sites in the spring. Although river otters visited less often and exhibited greater heterogeneity in scent marking among latrine sites in the fall than in the spring, they visited in larger groups that deposited more scent marks per visit in the fall than in the spring. Also, when river otters visited, the intensity of visitation within 24 hr was higher in the fall than during any other season. Thus, as Mills (2004) suggested, fall scent mark surveys also may be an effective means of detecting river otter presence. Our results are ambiguous as to the efficacy of winter scent mark surveys. Both visitation and heterogeneity of scent marking in winter were intermediate to spring and fall values. However, the frequency of scent marks during winter was lower than in spring and fall. Although we did not include other forms of sign (i.e. tracks or slides in snow) in our study, aerial surveys after snowfalls have been used to efficiently document the distribution of river otters in southern Minnesota, U.S.A. (Erb and Deperno, 2001). However, Gallant et al. (2007) discovered a poor relationship between the number of latrine sites used and the number of river otters detected using winter sign surveys in New Brunswick, Canada. Alternatively, snow-tracking surveys have proven successful in Finland (Sulkava and Liukko, 2007). Regardless, these methods require reliable snowfall and consistent snow cover (Erb and Deperno, 2001), conditions not occurring throughout the range of river otters. Finally, because of the high average number of days between visits and high heterogeneity in scent marking among latrine sites, our data suggests that scent mark surveys during the summer should be avoided. ACKNOWLEDGMENTS - A United States Fish and Wildlife Service State Wildlife Grant [administered by the Pennsylvania Game Commission (PGC)], the Pennsylvania Wild Resource Conservation Fund (WRCF; nongame tax-checkoff), and logistical support by the United States Department of Agriculture Allegheny National Forest (ANF) provided primary funding and support for this project. We are grateful to A. Hayden (deceased) and J. Hassinger of the PGC, F. Felbaum and R. Stanley of the WRCF and B. Nelson of the ANF for their cooperation and support of river otter research in Pennsylvania. J. E. Gates provided helpful comments on an earlier draft of this manuscript. REFERENCES Bekoff, M. and Jamieson, D. (1996). Ethics and the study
of carnivores: doing science while respecting animals. In: Gittleman,
J. L. (Ed.). Carnivore behavior, ecology, and evolution. Second
volume. Cornell University Press, Ithaca, New York, USA., pp. 15-45. Résumé: Variation
Saisonnière
dans l'Utilisation des Latrines et du Marquage par les Loutres de
Rivière (Lontra canadensis) Resumen: Variación
Estacional en Visitas a Sitios de Deposición y Marcas de
Olor en Nutrias (Lontra canadensis) de
Rio Cercanas Al Artico |


| [Copyright © 2006 - 2050 IUCN/SSC OSG] | [Home] | [Contact Us] |