IUCN/SSC Otter Specialist Group Bulletin

|
©IUCN/SCC Otter Specialist Group Volume 28 Issue 2 Pages 62 - 118 (October 2011) Citation: Hadipour, E., Karami, M., Abdoli, A., Borhan, R. and Goljani, R. (2011). A Study on Eurasian Otter (Lutra lutra) in Amirkelayeh Wildlife Refuge and International Wetland in Guilan Province, Northern Iran. IUCN Otter Spec. Group Bull. 28 (2): 84 - 98 A Study on Eurasian Otter (Lutra lutra) in Amirkelayeh Wildlife Refuge and International Wetland in Guilan Province, Northern Iran Ehsan Hadipour1, Mahmud Karami2, Asghar Abdoli3, Riazi Borhan4 and Reza Goljani4
1Department of environmental protections, Zip code 44138-66199 Lahijan- Iran. e-mail: Ehsanhadipour@yahoo.com |
| Received 2nd May 2011, accepted 30th October 2011 |
| Abstract: This is the first study on otters in the wetlands of Iran. We worked in Amirkelayeh Wildlife Refuge and International Wetland (Amirkelayeh W.R&I.W). In this investigation, we surveyed the quality of Eurasian otter (Lutra lutra) sign distribution as a species presence index on the coast of Amirkelayeh (W.R&I.W). During a nine month period of monthly surveys, 673 signs were identified of which the majority were spraints. The number of spraints during different months differed significantly (χ2 =408.732, P<0.05). The results indicated a close negative correlation between frequency of fish and frequency of spraints (r = -1, P<0.01). Shorelines of the wetland showed significant differences in the mean value of spraint number (K=19.628, P<0.05). There were two hot spots with values greater than 66% “Spraint Presence Intensity” (SPI) during the nine month period. The number of spraints and SPI were correlated significantly (r=0.793, P<0.01). In addition, significant differences among “Types Of Sprainting Places” (χ2=130.723, P<0.05) and also in “Height of Sprainting places” (χ2= 459.408, P< 0.05) were observed. More than 89% of spraints were within 200 cm of the nearest cover. Association between presences of spraints and canals (χ2= 21.547, P<0.05 and λ=0.086), and also “chars” (access routes through reed beds between land and open water) (χ2= 63.691, P<0.05 and λ=0.210) were shown. “Reed Bed Breadth” in places with and without spraints differed significantly (U=495, P<0.05). |
| Keywords: lutra, seasonal sprainting differences, spraints distribution pattern |
| Française | Español |
INTRODUCTION
Otters belong to the Mustelidae family, of which there are 13 species worldwide. More than half of them are listed as endangeredor vulnerable (IUCN 2010). Investigations on the Eurasian otter show that its population worldwide has been declining despite its role as a “key species” in the stability of ecosystems (Carss, 1995). Moreover, susceptibility of otters to habitat changes has been confirmed (Foster-Turley et al. 1998; Preston et al., 2006; Georgiev and Stoycheva, 2006). Existence of this “indicator species” in ecosystems, and conservation of their populations could relieve our anxieties about mankind’s living status (Tüzün and Albayrak, 2004). These unique characteristics led scientists to pay more attention to otters as an important and threatened species. Signs proved to be an essential tool to study their distribution in last decades (Reuther et al., 2000). Almost all studies on these animals, whatever their aims, are based on the distribution of spraints, scats or faeces (Kruuk, 2006). These olfactory signals, which play significant roles in carnivores (Rostain et al., 2004), are one of the essential aspects of behavioral strategies in otters. Roughly speaking, there are no carnivores that produce these olfactory signals with their anal glands as much as some species of otters. Spraint is a distinct sign of the existence of an otter at a location. The presence or absence of this sign is used in many investigations on otters. Signs could provide valuable information for conservation aims on a wide scale (Mason and Macdonald 1987; Reuther et al. 2000; Kruuk 2006). These considerations show the importance of study on sprainting differences (individual or seasonal) in otters (Reuther et al., 2000). Among 13 species of otters, two species are found in Iran, namely the Eurasian (common) otter (Lutra lutra) and the smooth-coated or smooth otter (Lutrogale perspicillata) (Ziaie, 2009). These are Near Threatened (NT) and Vulnerable (VU) according to IUCN red list (IUCN 2010).
Earlier reports indicated that the Eurasian otter exists in wetlands, rivers and ponds in Iran (Karami et al., 2006). In addition, we have reports from fishermen and local people of the Eurasian otter’s presence near the Caspian Sea shore. Since the species has a vast home range and there is particularly a lack of information on this species, conclusions about the Eurasian otter population is a difficult task. In the wake of the Ramsar Convention’s declaration on the Montreux Record, it was revealed that Iranian Wetlands are disappearing (Ramsar Convention, 2010), and unfortunately these are one of the main habitats of Eurasian otters in this country. There are great perils for Eurasian otters, mainly due to habitat loss, land use changes (annexation of parts of wetlands to rice farms), construction of roads through the wetlands, etc. Other habitat destruction factors are the overuse of water from wetlands and rivers for irrigating rice farms and other agricultural usages, sand exploitation in river beds, and soil and water pollution due to misuse of pesticides, herbicides, human and industrial wastes etc. Eurasian otter are hunted illegally (mainly for fur and taxidermy); They are persecuted around fish farms, being considered as an enemy of fishes and they are also slaughtered by cars on the roads. These are the main threats to otters in Iran (Kiabi, 1993; Mirzajani, 1999; Hamzehpour, 2005; Karami et al., 2006; Mirzaei et al., 2009). In addition, decreasing numbers of observations of otters around fish farms may suggest that the population in the north of Iran is decreasing (Mirzajani, 1999). In this investigation, Eurasian otter sign distribution (particularly spraints) as a species presence index and some of the behavioral aspects of Eurasian otter like seasonal sprainting differences and their relation with food sources were studied in the Amirkelayeh W.R&I.W. The wetland, despite its international importance, is experiencing all sorts of severe threats. This could lead to the elimination of the otter population in the Amirkelayeh ecosystem before many other animals.
STUDY AREA AND METHODS
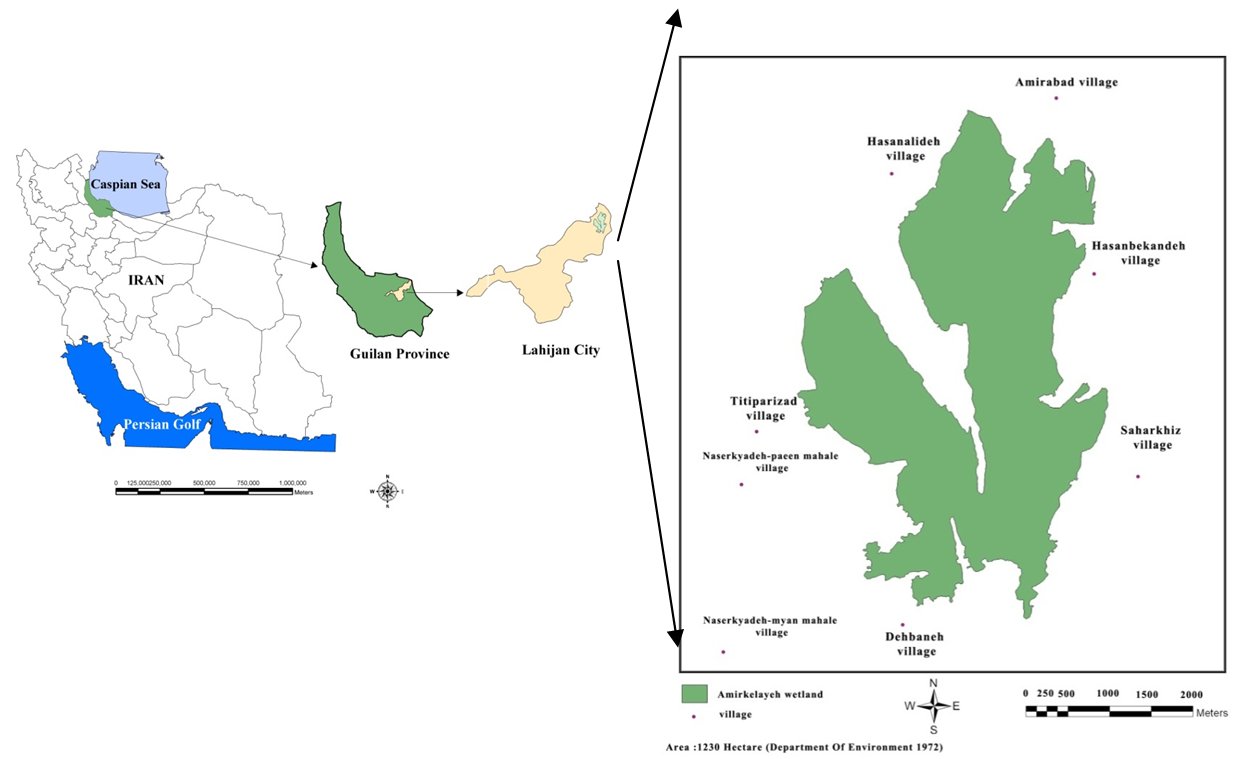
The study area, Amirkelayeh, is a Ramsar site in the northern part of Iran at 37°17´ N, 50° 12´E (Figure 1). This wetland, which has with 37 km of Caspian Sea coastal area, is surrounded by rice farmlands which belong to 8 villages (Figure 1). The Amirkelayeh wetland area was initially assigned 1230 hectares in 1971, but there were great changes in the area, because of land use change, up till 2008. The wetland lies between 27.2 m and 22.7 m below sea level. Moreover, Amirkelayeh W.R&I.W is considered the 18th most important wetland in Iran from an ecological importance viewpoint and has priority in conservation among 75 Iranian wetlands (Kiabi et al., 2005). The fauna and flora of Amirkelayeh consists of approximately 257 species including 75 plant species (Moradi, 1999), 15 fish (Nezami, 2004), 2 amphibians, 5 reptiles, 151 birds and 9 mammals (DOE ).
 |
|
Figure 1.
Study area; Amirkelayeh W.R&I.W, Lahijan city, Guilan province, Iran (click for larger version) |
This study was carried out between April 2009 and March 2010 on the entire coastal area of Amirkelayeh W.R&I.W, apart from a 4.8 km stretch of coast where access was very difficult due to deep, wide canals.
Sign Survey
The shore line of Amirkelayeh was surveyed for otter sign (spraints, tracks and pathways) every month for nine months. The location of all the observed signs were recorded using GPS (Garmin 76CSX) and enumerated. The Kruskal-Wallis test was used to compare all found spraints along the coast to test for differences in sprainting use by the Eurasian Otter. Due to anthropogenic effects, particularly the construction of water reservoirs and great disturbance of the coast at the far western end, we decided to use the other three parts of the coast (designated East, Middle, West) for this test. Chi-square test was performed to calculate the monthly sprainting differences on the coast of the wetland. For determination of “Spraint Presence Intensity” (SPI) in different places based on observation of spraint, we used the frequency of observations in percentage (FOb %) as the SPI. The coasts were divided into 50m×50m quadrates in places where sign was found, and the number of spraints was recorded during the 9 months. The frequency of observation was defined by the following equation (Equation 1).
| FOb% | = | number of occurances of spraint in a quadrate | x 100 |
|
|
|||
| number of visits | |||
| Equation 1 | |||
In order to prevent any statistical or biological errors, we simply used presence (1) and absence (0) of spraints in the quadrate in our other calculations. Associations between SPI and fish frequency and SPI with number of spraint were also tested by Spearman correlation coefficient test.
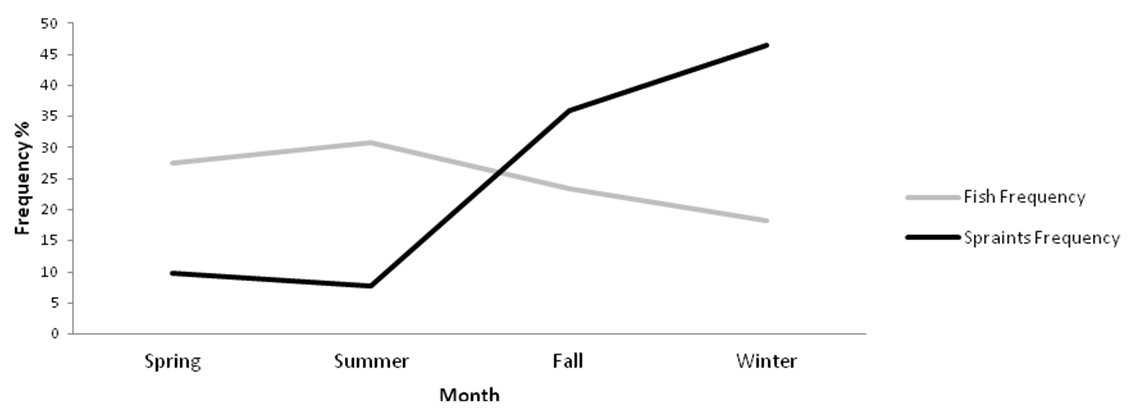
Fish frequency is the relative frequency of fishes in each season in percentage. For instance, total number of sampled fishes in 4 seasons (by net from Amirkelayeh wetland) was 1639 and the number of sampled fishes in spring was 451 it means that the relative frequency % of fishes in spring is 27.6 in spring.
Environmental Variables at Sprainting Sites
In order to gain a reasonable picture of sprainting sites distribution along the coast of the Amirkelayeh wetland, six types of environmental variables were measured, some with different categories (Table 1). The difference between categories of “Sprainting Place Type”, “Height of Sprainting Place” (HSP) and “Distance of Sprainting Place to nearest Cover” (DSC) was examined by Chi-square test. Association of spraint presence with the existence of canals and “chars” (local dialect for access ways made by local people through the reeds between land and the open water). were examined by χ2 contingency tables. For this, all canals and “chars” were recorded by GPS throughout the wetland, because no map was available; the whole coast of the wetland was then divided into 50m×50m quadrates. presence and absence of variables were recorded per quadrate. width of the fringing reed bed was measured by moving around the both sides (inner and outer side) of the reed bed. This is done by walking on the outer side and boating in the inner side in summer and winter seasons and recording position by GPS. By use of Mann-Whitney Test, we compared width of reed bed in the quadrates with or without spraints.
RESULTS AND DISCUSSION
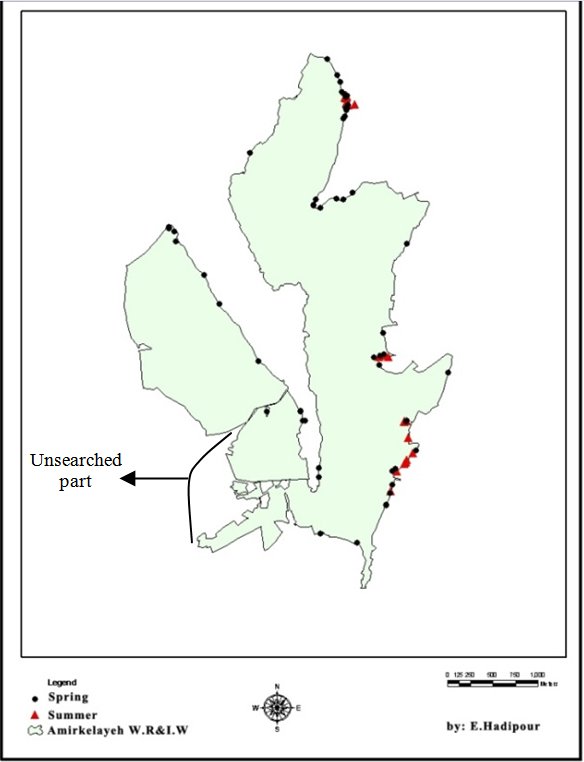
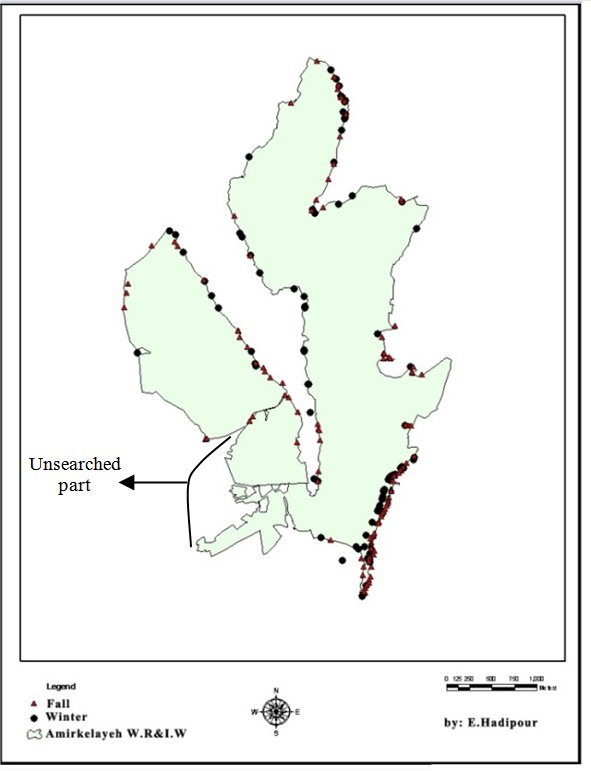
The sign survey was conducted each month for nine months, totaling almost 290 kilometers of travel around the wetland. Results show clearly the presence of otters sign through all seasons (Figure 2,3). The total number of signs observed was 673. Of these, 649 were spraints. The results indicate that the mean number of spraints found in per survey was 72.11 (Table 2).
 |
 |
| Figure 2.
Otter sign distribution (Spring to summer). (click for larger version) |
Figure 3.
Otter sign distribution (Fall to winter). (click for larger version) |
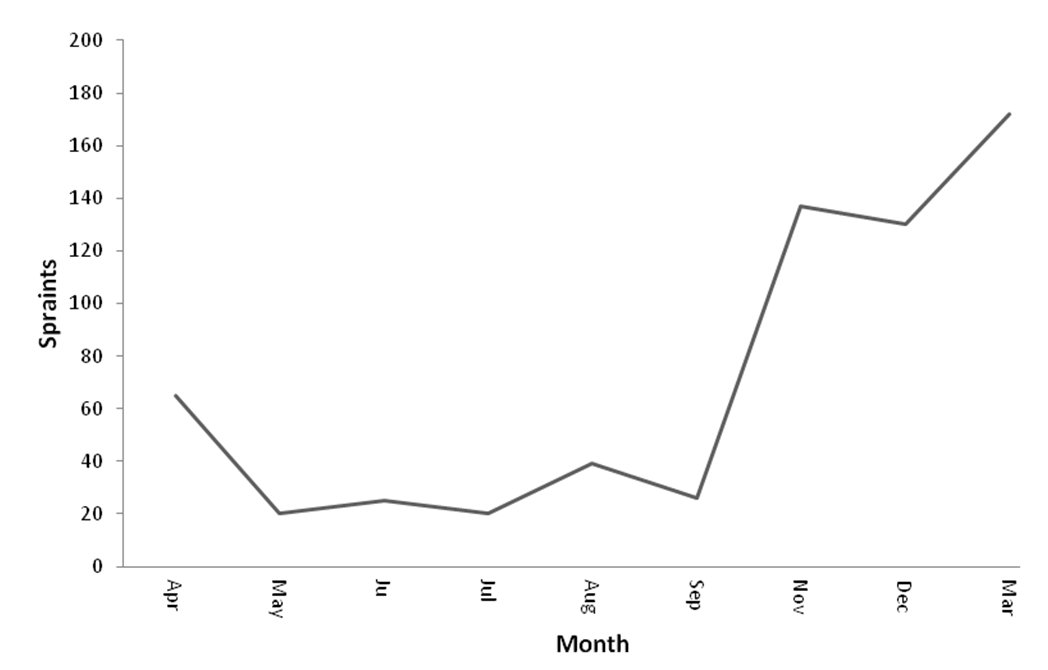
The number of signs found fluctuated in different months, especially spraints (Figure 4).
 |
| Figure 4.
Variation in number of spraints found across the nine month period (click for larger version) |
There is a similar monthly variation in tracks and pathways. Among different signs of the presence of otters, spraint is the most utilized in investigations (Mason and Macdonald 1987); we therefore paid more attentions to this sign. As is demonstrated in Figure 4, the numbers of spraints varied in every month. The number of spraints found between November and April is substantially different from the period May to September. The distribution of spraints also differs from what was hypothesized (χ2 =408.732 df=8, P<0.05), with a significant difference between numbers of spraints in different months. There are many factors which affect the finding of spraints, and number of spraints does not directly relate to the number of otters present. Food source availability, habitat structure, vegetation cover, preferred sprainting sites such as large stones, behavioral factors, maternal activity and seasonal sprainting variations and etc., have had influences on the number of spraints (Reuther et al., 2000; Rostain et al., 2004; Hamzehpour, 2005; Kruuk, 2006). One of the most important sprainting aspects is inhibition of inter or intraspecific competition through foraging activities. Sprainting has strong association with foraging and fishing by otters; also seasonal sprainting variations are associated with annual food availability fluctuations. (Kruuk, 2006). During season 4, we compared Spraint Frequency Percentage with Fish Frequency Percentage in the wetland (Nezami, 2004), assuming fish were the main food source, and found a high negative correlation between Fish Frequency and Spraint Frequency (r = -1, P<0.01) - Figure 5.
 |
| Figure 5.
Variation in number of spraints found across the nine month period (click for larger version) |
The negative correlation demonstrates the role of spraints in showing the main food sources (fish). High frequency of fishes can be caused by:
- high density of prey or
- high availability of prey
In summer, we observed an explosion in many animals’ populations. These animals are potentially part of the Eurasian otter’s diet such as amphibians, snakes, invertebrates and fish. However, fewer spraints were found than in winter, when more fish were observed. It appears that when the number of spraints found decreases, the number of fish observed increases. However, for a better judgment on this matter, further study is needed on the composition of otter diet in the Amirkelayeh wetland
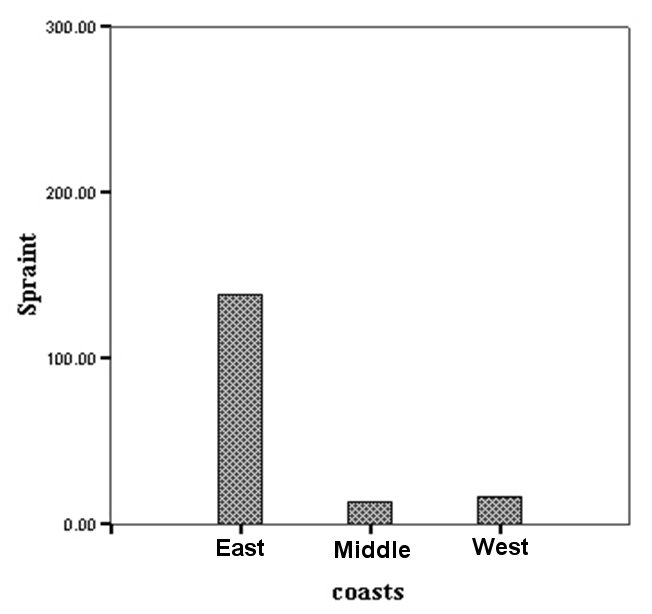
Different patterns of coastal usage for sprainting by Eurasian otters was found from the Kruskal-Wallis test. There is a significant difference between the different coastal stretched in number of spraints found (K=19.628 df= 2, P<0.05), indicating some preference by the otters for certain areas over others. The data shown in Figure 6 shows that otters used the eastern coastal area more than other areas.
 |
| Figure 6.
Variation in number of spraints found across the nine month period (click for larger version) |
The structure of the Amirkelayeh wetland, food source quality and distribution and anthropogenic threats may influence the distribution of spraints. The eastern branch of the wetland contains a big water body and it is the only open water area in the wetland. The western branch of wetland has continuous reed beds without any open water and there is no watercourse leading into it. It is clear that the eastern branch of the wetland has a higher fish population than the western one. This factor particularly, as well as other ones mentioned above, could be influencing the number of spraints found in the different coastal areas of the Amirkelayeh wetland. Although most spraint was found in the eastern area, this does not mean the the western reedbeds were not also used by the animals. Reed beds have important roles in attracting otters. The Eurasian otter likes to rest in reeds (Kruuk, 2006). The vast reed bed of the western branch would provide good opportunities for female otters to make natal holts and raise their young, removed from the main foraging area and threat of cannibalism or killing by other otters. It should be noted that otters do not spraint near natal holts (Kruuk, 2006). Thus, although the number of spraints on the western coast is less than on the other coasts, it doesn’t mean that the western branch of the wetland has low importance for otters.
132 quadrates (50×50m) were defined in areas where spraints were found. Calculation of FOb% (Equation 1) shows that 62.12% of quadrates have 11.11% SPI; 21.21% of quadrates contain 22.22% of SPI; 9.85% of quadrates show 33.33% of SPI; 5.3% of quadrates have 44.44% of SPI and the quadrates with the 66.67% and 100% of SPI form just 0.76% of observations. However, it is clear that otters usually return to specific places for sprainting. Since sprainting is under the influence of behavioral and individual variables, density of spraints may not draw a reliable picture of otter population. However, taking into account the role of spraints in the otters’ social organization and its function in the inhibition of intra and interspecific competition, and also specific features of spraintng behavior like visiting particular places repeatedly (Kruuk, 2006), we suggest the SPI can be used to define places which are visited very frequently by Eurasian otters.
Having determined these highly frequently visited locations, it may be possible to prepare a reasonable picture of otter population status in the Amirkelayeh wetland. Our results shows that there are nine quadrates with greater than 44% SPI. Only two hot spots with greater than 66% of SPI were found. This does not indicate a high density otter population in the wetland.
Performance of “Spearman correlation coefficient” calculation for number of spraints and SPI shows a significant positive correlation (r=0.793 P<0.01). Although the correlation shows that the quadrates with numerous spraints are visited more frequently than other places by otters through the year, there are some exceptions in our calculations. For instance, there are some quadrates with many spraints but with low level of SPI (For example, number of spraints in quadrate are 26 and its SPI is 22.22%), and on the other hand there are some quadrates with a lower number of spraints but with high SPI (for example, number of spraints in one quadrate was 6 but the SPI was 44.44%). Similar exceptions to this may lead to over- or underestimation of status of Eurasian otters here. These exceptions also show the importance of seasonal or monthly surveys in spraint-based studies on Eurasian otters.
The analysis of 282 sprainting places based on type of substrate shows a significant difference between those substrates (χ2=130.723 df=5, P<0.05), 37.49% of spraints were found on vegetation, particularly on grasses; the substrate of 22.7% of spraints was sand; 14.18% of spraints were on mud; 13.48% of spraining was done on artificial substances; 9.93% of spraints were found on stones/rocks and 1.77% were found on tree trunks. Vegetation, sand and mud are common in coastal areas, but artificial substances (like white gunnysacks, brightly-coloured pesticide or fertilizer containers, plastic tarpaulins over rice fields and so) and especially stones and rocks are rarely found along the shoreline. The significantly higher proportion of use of artificial substances and rocks for sprainting as shown above may indicate a preference for these in Eurasian otters.
The Height of Sprainting Place (HSP) categories have significant differences from each other (χ2= 459.408 df=4, P<0.05). Measurements of 196 HSP (Table 3) show that 80.10% of observed spraints were found at a height of <20 cm from the surrounding ground surface,16.33% were found at 20-40 cm, 1.53% were found at 40-60 and 60-80 cm, and finally 0.51% of them were at a height of >80 cm from the surrounding ground surface.
|
|
||
| Table 3: Descriptive statistic for measures of HSP (cm) | ||
|
|
||
| N | 196 | |
| Minimum (MIN) | 2 | .00 |
| Maximum (MAX) | 150 | .00 |
| Mean | 14 | .15 |
| Standard deviation (Std.Dev) | 15 | .53 |
| Variance (VAR) | 241 | .09 |
|
|
||
Use of agricultural machinery for making canals and digging trench in order to gain more water for rice fields from wetland, as well as using the coastal area specifically for cultivation frequently damages the coast structure in the Amirkelayeh wetland. Eurasian otters need particular structures for sprainting. It is necessary to preserve these natural characteristics of the coast which are vital for Eurasian otters, but this habitat has many anthropogenic disturbances which cause loss of potential usefulness to otters.
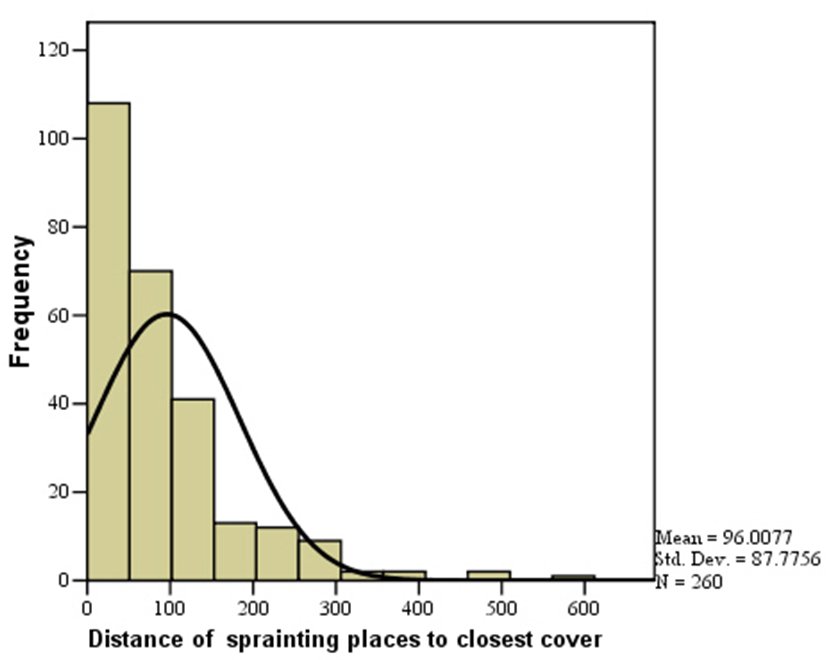
There are significant differences between the values of Distance of Sprainting Place to closest Cover or DSC - see Table 1 (χ2= 385.785 df=8, P<0.05). The distance of 260 sprainting places to closest cover (water and aquatic plants), was measured (Table 4). 68.5% of sprainting places were within 100 cm of nearest cover (Figure 7).Moreover 89.2% of spraints were within 200 cm of the nearest cover. It seems that otters are “multi-use cover” species. In the Amirkelayeh wetland, water bodies and aquatic plants act as cover, in combination with riparian plants, diversity of coast shape, roughness of land and so on. Although riparian plants dominate everywhere on the coast of this wetland, DSC was based on distance of spraints to water which usually contained with aquatic plants as appropriate cover
|
|
||
| Table 4: Descriptive statistic for measures of DSC (cm) | ||
|
|
||
| N | 260 | |
| MIN | 2 | .00 |
| MAX | 600 | .00 |
| Mean | 96 | .01 |
| Std.Dev | 87 | .78 |
| VAR | 7704 | .56 |
|
|
||
 |
| Figure 7. Sprainting places’ distance to nearest cover (click for larger version) |
These results show the relative significance of these types of cover for the otter who wants to go about its normal business along the coastline of wetland (Table 4 and also Figure 7). Our investigation shows that a narrow strip (~2 meters) of Amirkelayeh shoreline contained almost 90% of spraints.
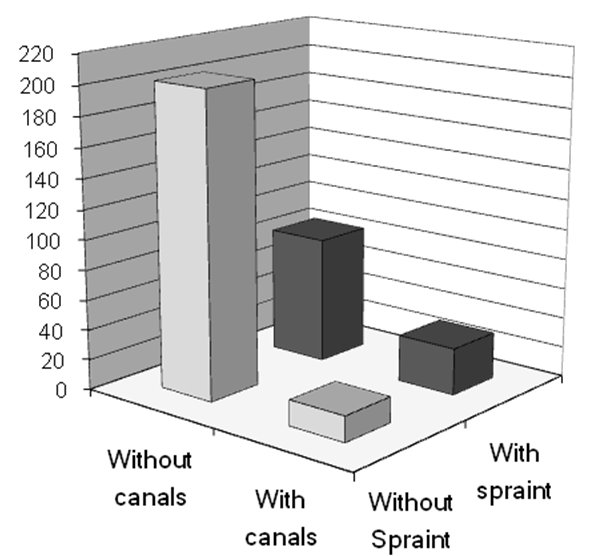
The association between presence of spraints and existence of canals (entrances or outlets of water) were examined in the 334 quadrates (Figure 8). The results show an association between two variables (χ2= 21.547, df=1, P<0.05 and λ=0.086). Yates' correction was performed for this test.
 |
| Figure 8. Presences of spraint and existence of canals in 334 quadrates (click for larger version) |
Since the observed value is greater than the expected value, these variables have positive association, i.e. they are appearing together and disappearing simultaneously. But the value of λ shows that the predicted value of presence of spraint with respect to the presence of canals is fairly weak. Predicting sprainting places to be by canals has only reduced the error 12.2% in comparison with the random prediction.
The dependency between spraint and “chars” was examined in the 273 quadrates (Figure 9). The observations show significant positive association between two variables (χ2= 63.69, df=1, P<0.05 and λ=0.210). Yates' correction was performed for this test too. However λ shows that prediction of presence of spraint with respect to “chars” is weak. Prediction of places with spraints by the existence of “chars” reduces the error rate of prediction 33% compared to random prediction which is rather greater than with canals. The results show that we could expect to find more spraints next to the “chars” than next to the canals
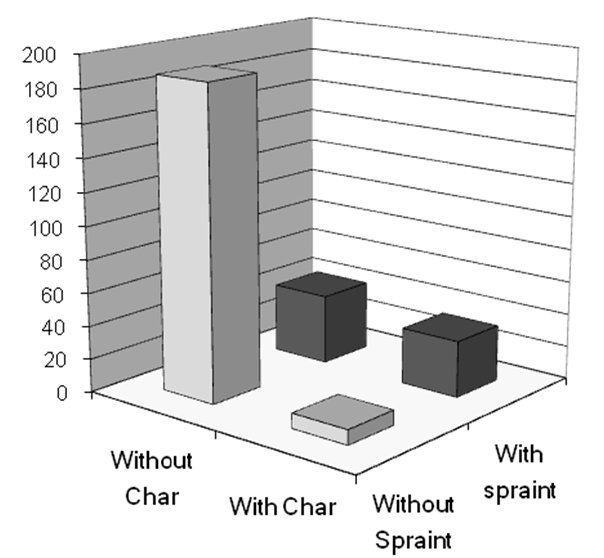 |
| Figure 9. Presences of spraint and existence of canals in 334 quadrates (click for larger version) |
Width of Reed bed was measured in the summer and winter. This was only done in eastern branch of the wetland as this is the only area that had any open water (Table 5). Reed bed width was measured in 77 places, which includes 37 quadrates with spraint and 40 random quadrates without spraint along the coast of wetland. Our results show that they have significant difference from each other (U=495 P=0.05). It has been realized that the quadrates with spraint are located beside narrower reed beds (Figure 10).
|
|
||||
| Table 5: statistic for measures of Reed Bed Width | ||||
|
|
||||
| Summer | Winter | |||
| N | 60 | 60 | ||
| MIN | 39 | .12 | 39 | .12 |
| MAX | 983 | .77 | 895 | .61 |
| Mean | 284 | .53 | 245 | .43 |
| Std.Dev | 166 | .50 | 147 | .08 |
| VAR | 27720 | .71 | 21631 | .80 |
|
|
||||
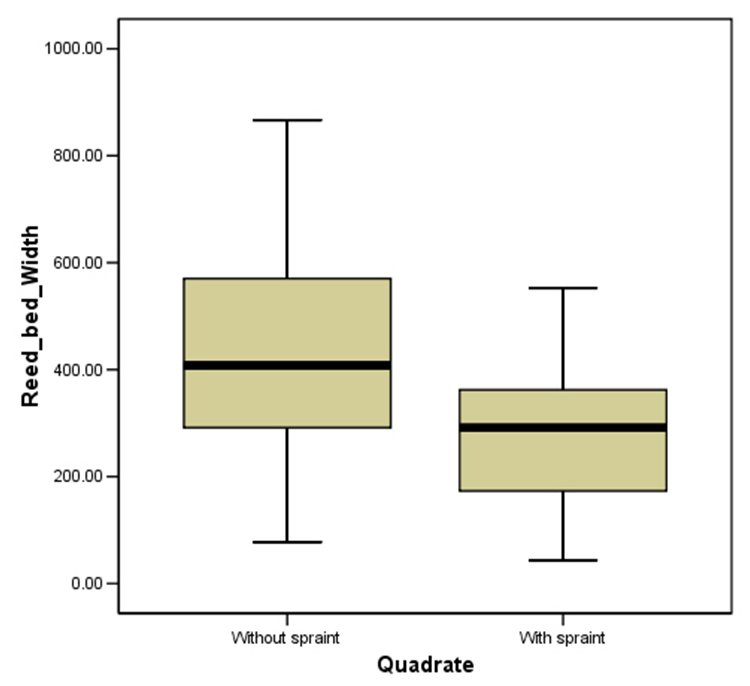 |
| Figure 10. Width of reed bed in quadrates with and without spraints (click for larger version) |
The presence of spraints on the places with low breadth of reed bed as well as the significant positive association between spraints and “chars” by 33% of that predicted shows the importance of energy saving strategies for Eurasian otters. Energy and heat loss factors are crucial for otters (Kruuk 2006). Moving through the reed bed to reach the coast has energy costs for otters; thus it may be appropriate for them to find a short cut (like “chars” or places with low breadth of reed bed) to reach the coast.
CONCLUSION
There are insufficient and sparse studies about Eurasian otters in Iran; indeed, there have been no studies to date on this species in Iranian wetlands. Knowing the different aspects of otter ecology helps us to understand the concepts important in otter conservation; the animals are rapidly disappearing in our vicinity as their habitat vanishes. Our investigation considered Eurasian otter distribution and some small aspects of ecology based on spraint surveys in the Amirkelayeh W.R&I.W, which is abounding with many threats. We showed that Eurasian otter signs were found throughout the year in the Amirkelayeh wetland. We also found distinct fluctuations in the signs especially spraints throughout the 9 month period of our study, which is positively correlated with food source fluctuations. In addition we have established that one area of the coast was more used than others due to food source availability. For elimination of statistical or biological errors, SPI was adopted. This defines the places that are very frequently visited by Eurasian otters. This may indicate a reasonably accurate picture of Eurasian otter status for us. There are only two hot spots on the coasts of the wetland. Moreover we showed significant positive correlation between number of spraints and SPI, with of course with some exceptions as was expressed above. Eurasian otters spraint on different substances at different heights above the surrounding ground survey in the Amirkelayeh wetland. Vegetation at heights of less than 20 cm were used abundantly. But the distribution of these sites are very important. The small distance of spraints to water and plants as cover shows the importance of safety to the otters. Furthermore, association between presence of spraint with canals, “chars” and places with narrower reed beds was shown.
RECOMMENDATIONS
Further studies on the diet composition of Eurasian otter and studies on anthropogenic effects on these animals are necessary for understanding the status of otters and for perception of the Eurasian otter’s ecological role in the Amirkelayeh Wildlife Refuge and International Wetland.
REFERENCES
Carss, N. (1995). Foraging Behavior and Feeding Ecology of the Otter Lutra lutra: A Selective Review. Hystrix 7 (1-2): 179-194.
Department of Environment (DOE) - Experts’ report (2005). "Amirkelayeh wetland". Unpublished.
Foster-Turley, P., Macdonald, S.M. (1998). Otters: An Action plan for otters. IUCN/SSC OSG.
Georgiev, D.G. & Stoycheva, S. (2006) Habitats, Distribution and Population Density Otter Survey in the Western Rhodopes Mountains (Southern Bulgaria) IUCN Otter Spec. Group Bull. 23 (1): 36 - 43
Hamzehpour, M. (2005). An investigation on otter's presence distribution and density in Deylaman-Dorfak non-huntig area -Guilan province. Department of Environment, Faculty of Environment and Energy. Tehran, Sciences and Research, Islamic Azad University. Master Thesis.
IUCN (2010). IUCN Red list of Threatened Species. from http://www.iucnredlist.org
Karami, M., Mirzaei, R., Hamzehpour, M. (2006). Status of Eurasian otter (Lutra lutra) in Iran. IUCN/SSC Otter Specialist Group Bull 23: 28-34.
Kiabi, B.H., Madjnoonian, H., Meygouni, H.G., Mansouri, J. (2005). Suggested standards for evaluating the priority of Iranian wetland's conservation. Journal of Environmental Studies 30(33): 74-89.
Kiabi, N. (1993). Otter. Aquatic Species Magazine 5: 10-15.
Kruuk, H. (2006). Otters: ecology, behaviour and conservation. Oxford University Press.
Mason, C.F., Macdonald, S.M. (1987). The use of spraints for surveying otter Lutra lutra populations: An Evaluation. Biological Conservation 41: 167-177.
Mirzaei, R., Karami, M., Danehkar,A., Abdoi, A. (2009). Habitat quaity assessment for the Eurasian otter on the river Jajrood, Iran. Hystrix, 20: 161-167.
Mirzajani, A. (1999). Study on common otter (Lutra lutra) status. The Environment 25: 70-74.
Moradi, A. (1999). Plant cover and phytosociological map of Amirkelayeh wetland. Faculty of Science and biology, Tarbiat Moalem University. Master Thesis: 133pp.
Nezami, S.A., Khara, H. (2004). Species composition and abundance of fishes in Amirkelayeh wetland. Iranian Scientific Fisheries Journal 12: 193-206.
Preston, S.J., Portig, A.A., Montgomery, W.I., McDonald, R.A. and Fairley, J.S. (2006). Status and Diet of the Otter Lutra lutra in Northern Ireland. Biology & Environment: Proceedings of the Royal Irish Academy, 106(1): 57-63
Ramsar Convention (2010). The montreox record. Available from http://www.ramsar.org
Reuther , C. , Dolch , D. , Green , R. , Jahrl , J. , Jefferies , D. , Krekemeyer , A. , Kucerova , M. , Madsen , A. B. , Romanowski , J. , Roche , K. , Ruiz-Olmo , J. , Teubner , J. & Trindade , A. (2000). Surveying and monitoring distribution and population trends of the Eurasian otter (Lutra lutra). Habitat , 12: 1–148
Rostain, R.G.R., M. Ben-David, et al. (2004). Why do river otters scent-mark? An experimental test of several hypotheses. Animal Behaviour 68: 703–711.
Tüzün, I. Albayrak, I (2004). The Effect of Disturbances to Habitat Quality on Otter (Lutra lutra) Activity in the River Kızılırmak (Turkey): a Case Study Turk. J. Zool 29: 327-335.
Ziaie, H. (2009). A field guide to the mammals of Iran. 3.
Résumé : Etude sur la Loutre (Lutra lutra) dans la Zone Protegee d’Amirkelayeh, Provine de Guilan, Iran du Nord
Il n'y a jamais eu d'étude sur les loutres dans les zones humides d'Iran en particulier dans la zone protégée d’Amirkelayeh (Amirkelayeh W.R & I.W). Dans cette enquête, nous avons analysé la qualité des signes de présence de la Loutre (Lutra lutra) sur la côte d’Amirkelayeh (W.R & I.W). Pendant une période de neuf mois, 673 indices ont été identifiés dont la majorité étaient des épreintes. Le nombre d'épreintes découvertes variait significativement selon les mois (χ2=408,732, P<0,05). Les résultats indiquent une étroite anticorrélation entre la fréquence des poissons et la fréquence des épreintes (r=-1, P<0,01). Les rives de la zone humide présentent des différences significatives dans la valeur moyenne des épreintes collectées (K=19,628, P<0,05). Il existe deux sites présentant des valeurs supérieures à 66% "intensité de la présence d’épreintes" (SPI). Le nombre d'épreintes et le SPI sont corrélées de façon significative (r=0,793, P<0,01). En outre, nous observons des différences significatives entre les types de sites de marquage (χ2=130,723, P<0,05) et aussi entre la « hauteur » de ces sites (χ2=459,408, P<0,05). Plus de 89% des épreintes ont été déposées sur deux premiers mètres de la rive. Le rapport entre présence d’épreintes et canaux (χ2=21,547, P<0,05 et λ=0,086), mais aussi avec les «chars» (χ2=63,691, P<0,05 et λ=0.210) a été démontré. Des couches sur lit de roseaux dans les lieux avec épreintes et sans épreintes sont quant à eux significativement différents (U=495, P<0,05).
Revenez au dessus
Resumen: Un Estudio de la Nutria Euroasiática (Lutra lutra) en el Refugio de Vida Silvestre y Zona Húmeda de Importancia Internacional de Amirkelayeh (Provincia de Guilan, Norte de Irán)
No existen estudios de nutrias en las zonas húmedas de Irán, ni en particular en el refugio de vida silvestre y zona húmeda de importancia internacional de Amirkelayeh (Amirkelayeh W.R&I.W). En la presente investigación muestreamos las huellas y señales de actividad de la nutria euroasiática para elaborar un índice de presencia de la especie en la costa de Amirkelayeh (W.R&I.W). Durante un período de nueve meses se identificaron 673 señales, la mayoría de las cuales eran excrementos. El número de excrementos presenta diferencias significativas intermensuales (χ2=408.732, P<0.05). Los resultados obtenidos indican una correlación negativa entre la frecuencia de peces y la frecuencia de excrementos (r = -1, P<0.01). Las riberas de las zonas húmedas presentan diferencias significativas respecto al valor medio del número de excrementos encontrados (K=19.628, P<0.05). Durante los nueve meses de estudio, se han detectado dos lugares donde los valores del índice de Intensidad de presencia de excrementos (SPI) son superiores al 66%. El número de excrementos y los valores del SPI correlacionan significativamente (r=0.793, P<0.01). Además, existen diferencias significativas entre las características de los lugares donde se encontraron los excrementos (χ2=130.723, P<0.05) así como entre las diferentes alturas sobre el nivel del suelo en que fueron localizados (χ2= 459.408, P< 0.05). Más del 89% de los excrementos estaban depositados a 0-200 cm de distancia de la cobertura vegetal más cercana. Existe una asociación significativa entre la presencia de excrementos y canales (χ2= 21.547, P<0.05 and λ=0.086), así como entre la presencia de excrementos y de suelos turbosos (χ2= 63.691, P<0.05 and λ=0.210). Finalmente, la cobertura de los cañaverales en lugares con y sin excrementos resultó ser diferente (U=495, P<0.05).
Vuelva a la tapa